
Abstract
With hardware advances in sensors, scientific instruments, and data storage techniques has come the inevitable flood of data that threatens to render traditional approaches to data analysis inadequate. The classic paradigm of a scientist manually and exhaustively going through a dataset is no longer feasible for many problems, ranging from remote sensing, astronomy, and atmospheric science to medicine, molecular biology, and biochemistry. This article presents our views as practitioners engaged in building computational systems to help scientists analyze and reduce massive datasets. We focus on what we view as challenges and shortcomings of the current state-of-the-art in data analysis in view of the massive datasets that are still awaiting analysis. The presentation focuses on recent and current scientific data analysis applications in astronomy, planetary sciences, solar physics, and atmospheric science that we have been involved with at the Jet Propulsion Laboratory (JPL).
1 Introduction
With hardware advances in instruments and data storage techniques comes the inevitable flood of scientific data that renders traditional approaches to scientific discovery in large data sets inadequate. The traditional approach of manually examining a data set and exhaustively cataloging and characterizing objects of interest is often no longer feasible for many tasks in fields such as geology, astronomy, ecology, atmospheric and ocean sciences, medicine, molecular biology, and biochemistry. Furthermore, traditional statistical approaches often require significant manual intervention, are not integrated with databases, and require a significant degree of expertise in statistics on the part of their users. These aspects of conventional statistical analysis can lead to a variety of problems for general
(non-statistician) “owners” of massive data sets. Much is missing between the data and the statistical algorithm, and between the statistical algorithm and the end user – the unfortunate scientist at the output end of the data firehose.
The problem of dealing with huge volumes of data accumulated from a variety of sources is now largely recognized across many scientific disciplines. Database sizes are already being measured in terabytes (1012 bytes) (Weir, Djorgovski, and Fayyad 1995), Barclay et al. 1998) and problems associated with data sets of this size will only become more acute with the advent of new sensors and instruments (Wilson and Backlund 1992, Fasman, Cuticchia, and Kingsbury 1994). There exists a critical need for information processing technologies and methodologies to manage this data avalanche. The future of scientific information processing hinges upon the development of algorithms and software that enable scientists
to interact effectively with large scientific data sets.
This paper reviews several ongoing automated science cataloging projects at the Jet Propulsion Laboratory (JPL) under NASA sponsorship and discusses some general implications for analysis of massive data sets in this context. Since much of NASA’s data are remotely-sensed image data, the cataloging projects have focused mainly on spatial databases. These data are essentially large collections of spatially-gridded sensor measurements of the deep sky, atmospheres and oceans, and planetary surfaces. The sensors operate within particular frequency bands such as optical, infra-red, and microwave. It is important to keep in mind that scientific investigators are not directly interested in the image data per se. They are primarily interested in using the image data to investigate hypotheses about the physical properties of the target being imaged. Hence, the image data serve as an intermediate representation that facilitate the scientific process of suggesting hypotheses or inferring a conclusion from the available evidence.
We focus on two concrete examples of data sets where automated cataloging is essential: the Second Palomar Observatory Sky Survey (POSS-II) and the Magellan-SAR (Synthetic Aperture Radar) imagery of Venus returned by the Magellan spacecraft. Both of these image databases are too large for manual visual analysis and provide excellent examples of the need for automated analysis tools. They also highlight the large gap which exists between raw data and analyzable data. Significant classification, clustering, and feature extraction problems often need to be solved before the data are ready for analysis. For example, suppose in a sky survey that image processing is used to reduce data from images to a catalog of feature measurements. This catalog is of little use unless each data item is also categorized as a star or a galaxy (and there are many other subclasses of course). Any scientific analysis in this context is predicated on an accurate solution to this classification problem. The latter in itself may be a difficult problem that is not easy for an astronomer to solve.
The POSS-II application demonstrates the benefits of using a trainable classification approach in a context where the transformation from pixel space to feature space is well-understood. Scientists often find it easier to define features of objects of interest than to produce recognizers (models, classifiers) of these objects. POSS-II illustrates the effective use of prior knowledge for defining features useful for classification. For this application, the primary technical challenges were in developing a classification model in the resulting (relatively) high-dimensional feature space. We later use it to illustrate problems of clustering or discovery of new objects.
In the Magellan data set of images of Venus (discussed in Section 2.2) the image analysis component of the problem was quite challenging. The domain experts were unable to provide much information beyond labeling objects in noisy images. In this case, the significant challenges in developing a cataloging system lie in the feature extraction stage: moving from a pixel representation to a relatively invariant feature representation.
1.1 Developing Science Catalogs from Data
In a typical science data cataloging problem, there are several important steps:
- Decide what phenomena are to be studied, or what hypotheses are to be evaluated.
- Collect the observations. If the data are already in existence then decide which subsets of the data are of interest and what transformations or preprocessing are necessary.
- Find all events of interest in the data and create a catalog of these with relevant measurements of properties.
- Use the catalog to evaluate current hypotheses or formulate new hypotheses of underlying phenomena.
In the POSS-II astronomy application (Section 2.1), Step 1 was fairly well understood and mature. Our goals were to attempt to catalog objects at least one iso photostat magnitude fainter than believed possible using existing computational approaches and later use the produced catalog to find rare objects of high scientific interest such as quasars (Step 1).
Collecting the data was a question of expense, effort and technology. We started the project assuming the data existed (Step 2). The preprocessing was based on an existing state-of-the-art image processing system. Step 3 was the fundamental challenge: recognizing faint object prior to cataloging. Step 4 includes testing theories about formation of large structure in the Universe, verifying or refuting predictions on older distributions regarding star-galaxy distributions, probing Galactic structure from star counts, and using the catalog to focus further specialized study in areas of the sky likely to contain objects under hot pursuit by the scientific community (Weir, Djorgovski and Fayyad 1995, Kenne ck at al 1995). In the volcano detection problem Steps 1 and 2 were decided a prior over a decade before. The event of interest in Step 3 was the recognition of small volcanoes. Finding the volcanoes was a challenge because no specialized image processing system was available for this data. Step 4 included modeling and understanding the geologic evolution of Venus and the factors affecting its surface appearance. Both are topics of current scientific debate in planetary geology (Cattermole 1994).
In both of the applications, the recognition and cataloging task was a necessary step to proceed with further scientific analysis. It is typically the case that most of the work, especially in the context of massive data sets, is in Step 3: the cataloging task. It is this task that is most tedious and typically prohibitive since it requires whoever is doing the searching, be it a person or a machine, to sift through vast amounts of data. When dealing with large amounts of data even the simplest manipulations of the data can become a grand challenge. Data management, bookkeeping, tracking lineage and transformations, and various database system-issues easily become overwhelming. Note that the most significant “creative” scientific analysis is typically carried out in the other steps (particularly 1 and 4).
In some cataloging operations, the recognition task may in principle be carried out by a human, i.e., a trained scientist can recognize the target when they come across it in the data (modulo fatigue, boredom, and other human factors). However, asking the scientist to write a procedure, or computer program, to perform the recognition, is a much more difficult problem and may not be possible. Translating human recognition and decision-making procedures into algorithmic constraints that operate on raw data is in many cases impractical. One possible solution is the pattern recognition or training-by-example approach: a user trains the system by identifying objects of interest and the system automatically builds a recognition model rather than having the user directly specifying the model. In a sense, this training-by-example approach is a type of exploratory data analysis (EDA) where the scientist knows what to look for, but does not know how to specify the search procedure in an algorithmic manner. An important issue is often the effective and appropriate use of prior knowledge. For the problem of recognizing spatial objects from pixel data, prior information about spatial constraints, in-variance information, sensor noise models, and so forth, can be invaluable, a point elegantly discussed in Geman, Bienenstock and Doursat (1992).
2 Science Cataloging Applications at JPL
2.1 Application 1: The SKICAT Project
The Sky Image Cataloging and Analysis Tool (SKICAT, pronounced \sky-cat”) has been developed for use on the images resulting from the POSS-II conducted by Caltech. The photographic plates are digitized via high-resolution scanners resulting in about 3,000 digital images of 23; 040 23; 040 pixels each, 16 bits/pixel, totaling over three terabytes of data. When complete, the survey will cover the entire northern sky in three colors, detecting virtually every sky object down to a B magnitude of 22 (a normalized measure of object brightness). This is at least one magnitude fainter than previous comparable photographic surveys. It is estimated that at least 5 107 galaxies and 2 109 stellar objects (including over 105 quasars) will be detected. This data set will be the most comprehensive large-scale imaging survey produced to date and will not be surpassed in scope until the completion of a fully digital all-sky survey.
The purpose of SKICAT is to facilitate the extraction of meaningful information from such a large data set in an efficient and timely manner. The first step in analyzing the results of a sky survey is to detect each object and measure features associated with it. In order to catalog the detected object, its class must be identified. Once the objects have been classified, further scientific analysis can proceed. For example, the resulting catalog may be used to test models of the formation of large-scale structure in the universe, probe Galactic structure from star counts, perform automatic identifications of radio or infrared sources, and so forth (Djogovski, Weir, and Fayyad 1994, Weir, Fayyad and Djorgovski 1995, Weir, Djorgovski and Fayyad 1995). Reducing the images to catalog entries is an overwhelming manual task. SKICAT automates this process, providing a consistent and uniform methodology for reducing the data sets.
2.1.1 Classifying Sky Objects
Each of the 3,000 digital images is subdivided into a set of partially overlapping frames. Low-level image processing and object separation is performed by a modified version of the FOCAS image processing software (Jarvis and Tyson 1981). Features are then measured based on this segmentation. The total number of features measured for each object by SKICAT is 40, including magnitudes, areas, sky brightness, peak values, and intensity weighted and unweighted pixel moments. Some of these features are generic in the sense that they are typically used in analyses of astronomical image data (Valdes 1982). Other features such as normalized and non-linear combinations are derived from the generic set. Once all the features are measured for each object, final classification is performed on the catalog. The goal is to classify objects into four major categories, following the original scheme in FOCAS: star, star with fuzz, galaxy, and artifact (an artifact represents anything that is not a sky object, e.g. satellite or airplane trace, film aberrations, and so forth).
2.1.2 Classifying Faint Sky Objects
In addition to the scanned photographic plates, we have access to higher resolution digital (CCD) images that span several small regions in some of the plates. The main advantage of a CCD image is higher spatial resolution and higher signal-to-noise ratio. Hence, many of the objects that are too faint to be classified by inspection on a photographic plate (POSS-II image) are easily classifiable in a CCD image. An example is illustrated in Figure 1. While
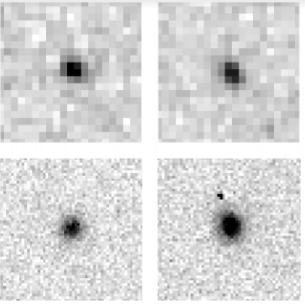
Figure 1: Two sample sky objects, a galaxy (left) and a star (right), as viewed in low resolution POSS-II images (top row) and in high resolution CCD images (bottom row).
the objects in the plate image are unrecognizable (top row in the figure), the CCD versions of these images (bottom row) are readily and accurately recognizable as galaxy versus star by trained astronomers. In addition to using these images for photometric calibration of the photographic plates, the CCD images are used for two purposes during training of the classification algorithm:
- They enable manual identification of class labels for training on faint objects in the original (lower resolution) photographic plates, and
- they provide a basis for accurate assessment of human and algorithmic classification performance on the lower resolution plates.
The SKICAT classification learning algorithms used are decision tree based . They differ from other traditional decision tree algorithms in several ways. The class of measures used for attribute selection are different than CART (Breiman et al 1984) or C4.5 (Quinlan, 1986). The discretization of numeric-valued attributes during the growth of the tree also differs since the algorithms we use derive multiple interval discretization rather than binary discretization in CART or C4.5. The particular algorithms used in SKICAT are covered in Fayyad and Irani (1993), Fayyad (1994), and Fayyad, Djorgovski and Weir (1996). The basic approach is to use greedy tree growing algorithms to find a classifier in the high dimensional feature space. SKICAT employs a learning algorithm called RULER (Fayyad, Weir and Djorgovski 1993) which builds many trees and selects a set of optimized classification rules from the set of trees. A rule is a single path from a decision tree’s root to one leaf. RULER applies pruning techniques to rules rather than trees as in CART. The decision trees are built using multiple random sampling of data subsets and cross validation.
2.1.3 SKICAT Classification Results
Stable test classification error rates of about 94% were obtained using RULER, compared to the original trees which had an accuracy of about 90%. Note that such high classification accuracy results could only be obtained after expending significant effort on defining more robust features that captured sufficient invariances between various plates. When the same experiments were conducted using only the generic features measured by the standard schemes, the results were significantly worse. The SKICAT classifier correctly classified the majority of faint objects (using only the original lower resolution plates) which even the astronomers cannot classify without looking at the special CCD plates: these objects are at least one magnitude fainter than objects cataloged in previous surveys. This results in a 200% increase in the number of classified sky objects available for scientific analysis in the resulting sky catalog database.
A consequence of the SKICAT work is a fundamental change in the notion of a sky catalog from the classical static entity \in print,” to a dynamic on-line database. The catalog generated by SKICAT will eventually contain about two billion entries representing hundreds of millions of sky objects. SKICAT is part of the development of a new generation of intelligent scientific analysis tools. Without the availability of these tools for the first survey (POSS-I) conducted over four decades ago, no objective and comprehensive analysis of the data was possible. It is estimated that no more than 5% of POSS-I data was ever really used.
2.1.4 Why was SKICAT Successful?
It is important to point out why a decision-tree based approach was effective in solving a problem that was very difficult for astronomers to solve. Indeed there were numerous attempts (without much success) by astronomers to hand-code a classifier that would separate stars from galaxies at the faintest levels. This lack of success was likely due to the dimensionality of the feature space and the non-linearity of the underlying decision boundaries. Historically, efforts involving principal component analysis, or “manual” classifier construction, by projecting the data down to 2 or 3 dimensions and then searching for decision boundaries, did not lead to good results (Weir, Djorgovski and Fayyad 1995).
Based on the results using the tree and rule generating algorithms in SKICAT, it appears that accurate classification of the faint objects requires referencing at least 8 particular attributes. Projections to low dimensions lose critical information. On the other hand, human visualization and design skills cannot go beyond 2 to 4 dimensions. This classification problem is an excellent example of a problem where experts knew what features to measure, but not how to use them for classification. From the 40-dimensional feature-space, the decision tree and rule algorithms were able to extract the relevant discriminative information. A typical tree (or corresponding set of rules) tended to use at least the 8 crucial attributes. Other attributes were used but did not consistently appear in different runs of the tree growing algorithm. One can conclude that the combination of scientist-supplied features (encoding prior knowledge) and automated identification of relevant features for discriminative rules were both critical factors in the success of the SKICAT project.
2.2 Application 2: Cataloging Volcanoes in Magellan-SAR Images
On May 4th 1989 the Magellan spacecraft was launched from Earth on a mapping mission to
Venus. Magellan entered an elliptical orbit around Venus in August 1990 and subsequently
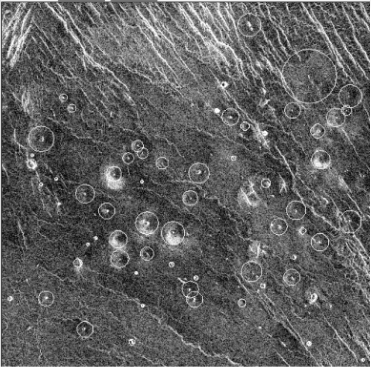
Figure 2: A Magellan-SAR image with a set of labelled volcanoes. Geologists use an interactive mouse-based interface to locate volcanoes and provide estimates of their diameters by fitting circles around them.
transmitted back to Earth more data than that from all past planetary missions combined (Saunders et al 1992). In particular, a set of approximately 30,000, 1024 1024 pixel, synthetic aperture radar (SAR), 75m/pixel resolution images of the planet’s surface were transmitted, resulting in a high resolution map of 97% of the surface of Venus (see Figure 2 for an example). The total combined volume of pre-Magellan Venus image data available from various earlier US and USSR spacecraft and ground-based observations represents only a tiny fraction of the Magellan data set. Thus, the Magellan mission has provided planetary scientists with an unprecedented data set for Venus science analysis. It is anticipated that the study of the Magellan data set will continue well into the next century (Science: Special Issue on Magel lan Data 1991, Cattermole 1994).
The study of volcanic processes is essential to an understanding of the geologic evolution of the planet (Saunders 1992) and volcanoes are by far the single most visible geologic feature in the Magellan data set. In fact, there are estimated to be on the order of 106 visible volcanoes scattered throughout the 30,000 images (Aubele and Slyuta 1990). Central to any volcanic study is a catalog identifying the location, size, and characteristics of each volcano. Such a catalog would enable scientists to use the data to support various scientific theories and analyses. For example, volcanic spatial clustering patterns can be correlated with other known and mapped geologic features such as mean planetary radius to provide evidence for (or against) particular theories of planetary history. However, it has been estimated that manually producing such a catalog of volcanoes would require 10 continuous man-years of a planetary geologist’s time. In practice, geologists to date have been manually cataloging small portions of the data set (local regions of the planet) and inferring what they can from these data (Guest et al 1992).
2.2.1 Automated Detection of Volcanoes
At JPL we have developed a pattern recognition system for volcano classification based on matched filtering, principal component analysis (PCA), and quadratic discriminants.
Geologists label sets of images to provide training data to build the system. A typical image (see Figure 2) contains either no volcanoes at all or else will have between 10 to 50 volcanoes. The participating scientists labeled about 100 images in total, resulting in a training data set containing on the order of 300 volcanoes. In order to perform classification, the following procedure , depicted in Figure 3, is used:
- A simple matched later (consisting of the average of all volcano images of size 15 15 pixels) is convolved with each image and thresholded to provide a list of potential locations for volcanoes. Typically this matched filtering process is quite noisy, with many non-volcano structures (such as ends of lines) being detected.
- Local images at each detected location (from Step 1) of size 15 15 pixels are then projected into the first k principal component directions (typically k = 6 is used) to derive a feature-based representation of each local image region. The principal component directions are derived from the labeled 15 15 volcano images, treating each one as a vector and performing standard PCA. The resulting principal component directions serve to characterize in a low-dimensional manner some of the basic modes of variability in the images (Figure 4).
- Finally, in the k-dimensional principal component space, standard classification techniques are used to discriminate between volcanoes and non-volcanoes. Quadratic
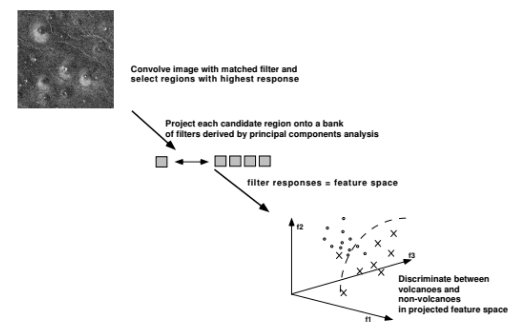
Figure 3: A schematic description of the JARtool system for locating and classifying volcanoes in Magellan-SAR images.
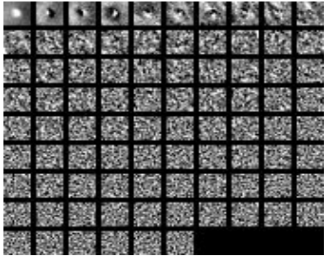
Figure 4: Principal component directions (“eigenvolcanoes”), displayed as images, derived from a set of 15 15 pixel-square volcano images.
(Gaussian) classifiers were more accurate than linear discriminants on this problem and as accurate as more sophisticated classifiers (such as decision trees and neural networks) (Burl et al. 1998).
Over certain regions of the planet the system has roughly the same classification accuracy as geologists (Burl et al. 1994). On a more global scale, the system is not currently competitive with human classification performance due to the wide variability in the visual appearance of the volcanoes and the relatively low signal-to-noise ratio of the images (Burl et al. 1998).
For this problem the technical challenges were in the detection and feature extraction parts of the problem. Unlike the stars and galaxies in the SKICAT data, volcanoes are surrounded by a large amount of background clutter (such as linear and small non-volcano circular features) which renders the detection problem quite difficult. Locating candidate local pixel regions and then extracting descriptive features from these regions is non-trivial to do in an effective manner. One particular challenge is the fact that in a complex multi-stage detection system, it is difficult to jointly optimize the parameters of each individual component algorithm. For example, deciding on the appropriate threshold for the matched filter affects the classification performance in PCA space in a non-linear manner. This is not easy to assess or model.
A further source of difficulty has been the subjective interpretation problem. Scientists are not completely consistent among themselves in terms of manual volcano detection and so there is no absolute ground truth. This adds an extra level of complexity to model training and performance evaluation (Smyth et al. 1996). Thus, in the general scheme of science cataloging applications at JPL, the volcano project has turned out to be one of the more difficult. Nonetheless, the general concept has proven extremely useful and forms the basis for continuing work at JPL on problems such as cataloging of craters on planetary surfaces using models automatically built from scientist-labeled images (Burl et al., in press).
2.3 Other Related Examples of Science Cataloging Tasks
Several other ongoing automated cataloging projects at JPL include temporal as well as spatial data measurements. A major emerging theme is the the acquisition by NASA of scientific data containing a prominent temporal component. This added dimension often dramatically increases the size and complexity of associated data sets and algorithms, and poses significant new challenges. Nonetheless, the potential pay-o in terms of scientific discovery is enormous, as these datasets offer us the ability to understand the nature of underlying physical processes by directly analyzing temporal and spatio-temporal information. We cover three such examples here.
The first project’s goal is to catalog sunspots (and other visible phenomena) from daily images of the Sun taken at various wavelengths. The data consist of a sequence of 4 106 pixel images taken every day for roughly the past 20 years. Of interest here is the fact that there is considerable prior knowledge (going back to the time of Galileo) about the spatial and temporal evolution of sunspots on the surface of the Sun. How to incorporate this prior information effectively in an automated cataloging system is a non-trivial technical issue. Results using Markov random field image segmentation techniques, coupled with Bayesian priors based on solar scientists’ experience in solar image analysis, have yielded promising results to date (Turmon, Pap and Mukhtar 1997, Turmon 1997, Turmon and Mukhtar 1998).
The second application involves the analysis of spatio-temporal measurements of the Earth’s atmosphere. Geo-potential height data measurements (the height in meters at which the atmosphere attains a certain pressure) have been collected twice daily since 1948 on a grid of 540 points over the Earth’s northern hemisphere. “Regimes” are defined as spatial patterns in the atmosphere which recur across multiple years. The existence, shape, and number of regimes have important implications in understanding and predicting the Earth’s climate. A long-standing problem in atmospheric science has been the reliable identification and validation of these regime patterns (Cheng and Wallace 1993). Cluster models using Gaussian mixtures and cross-validated likelihood for model selection have recently been used to provide the first relatively objective answer to this question. Specifically, the data since 1948 support the existence of three specific regime patterns (Smyth, Ide and Ghil, in press). Given these patterns, individual days are classified as belonging to specific regimes or not, providing a foundation for a relatively high-level analysis of temporal properties of transition behavior, regime durations, and so forth.
In terms of the time-scales of climate change, direct observational data is necessarily quite limited. For example, data for the latter half of this century does not necessarily tell us much about climate changes which occur on a temporal scale of decades or centuries. Thus, simulation models play a very important role in atmospheric and ocean science, allowing 4-dimensional simulations in space-time. These models can generate simulations of the Earth’s climate at a variety of spatio-temporal resolutions and can produce up to 30 terabytes of output per run. The vast majority of the simulated data set is not interesting to the scientist. Of interest are specific structural patterns such as cyclones, ocean eddies, and so forth. Thus, detection of atmospheric patterns (such as cyclones) in both simulated global climate model data and actual observational data is an important problem. The recognition components of the problem is typically straightforward, involving a search for local pressure minima and then tracking them over time to produce an (x; y; z) list of time-dependent coordinates for each cyclone center (Stolorz et al. 1995). Given a list of such cyclones from (say) a data set spanning 20 winters, aggregate properties of the set of cyclones are of interest, such as whether or not there exist clusters of distinct cyclone trajectories. Typically this clustering has been performed using techniques such as k-means clustering (Blender, Fraedrich and Lunkeit 1997). However, treating the trajectories as vectors ignores the underlying smooth trajectory information in physical space. Model-based clustering using mixtures of regression models for clustering directly in trajectory space can in principle provide a more robust and sound framework for clustering in this context (Gffaney and Smyth 1999).
The third project focuses on the analysis of comet images collected by spacecraft in earth orbit. The SWUIS detector own on the Space Shuttle in July 1997 collected over 300,000 images of comet Hale-Bopp. Methods currently under development will be able to segment each of these according to scientifically meaningful criteria so that features such as cometary jets can be tagged and tracked as they grow and change during the course of the image sequence. Other important features such as the measurement of sodium-ion tails can also be extracted by analysis of spectral data.
Given the data rates for current and planned JPL and NASA observation missions, there are likely to continue to be many such applications in the foreseeable future (Stolorz and Cheeseman 1998). A significant benefit of having convenient and easy to use detection and data reduction algorithms is that it enables autonomous or semi-autonomous spacecraft missions. For example, observation platforms can take advantage of on-board scientific processing power to direct the acquisition of high-quality scientific data by responding to important transient events such as unexpected surface motion, volcanic plumes, dust storms, the appearance of unexpected satellites around target bodies, and so forth. Without an automated capability to sift through large image streams looking for and agging suggestive events, the opportunity to study these phenomena at high resolution would be missed. Several of these ideas and the role that this approach can be expected to play in the future NASA mission set are discussed further in (Stolorz and Cheesman 1998).
3 General Implications for the Analysis of Massive Data Sets
The applications outlined above include a number of common challenges, including the size of the underlying data sets, the human factors aspects of data analysis, and the difficulties of harnessing relevant scientific prior knowledge. These and related topics are discussed below in a more general context.
3.1 Complexity Issues for Classification Problems
Due to their size, massive data sets can quickly impose limitations on the algorithmic complexity of data analysis. Let N be the total available number of data points in the data set. For large N, linear or sub-linear complexity in N is highly desirable. Sublinear here refers to the size of the entire database and hence applies to algorithms that make effective use of sampling or algorithms that can build an effective model with less than a scan of the database (Bradley, Fayyad and Reina 1998). Algorithms with complexity O(N2) are essentially impractical for massive data sets. Some might argue anything above O(N) is unacceptable. This would seem to rule out the use of many exploratory data analysis algorithms, for example, many types of clustering such as hierarchical agglomerative clustering (Duda and Hart 1973).
However, in reality, one does not necessarily need to use all of the data in one pass of an algorithm. In developing automated cataloging systems as described above, it is possible to make do with a small sample or multiple small samples. Alternatively, one can decompose the problem so that sufficient statistics are gathered in a fast pass over the data, and more intricate model search occurs over the smaller representation of the data. Examples of this for classification are found in in (Shafer, Agrawal and Mehta 1996, Chaudhuri, Fayyad and Bernhardt 1999). The primary theme is to overcome complexity by reducing the amount of data operated upon by the expensive model building part of the algorithm.
3.1.1 Supervised Classification
A supervised classification problem is typically fast. Since the training data needs to be manually labeled by humans, the size of this labeled portion of the data set is usually a vanishingly small fraction of the overall data set. In the Magellan-SAR data, for example, on the order of 100 images have been labeled for volcano content (with considerable time and effort), or about 0.3% of the overall image set. Relative to the overall size of the data set, the data available for model construction can be quite small, and hence complexity (within the bounds of reason) may not to be a significant issue in model construction.
Once the model is constructed, prediction (classification) is typically performed on the entire massive data set, for example, on the other 99.7% of unlabelled Magellan-SAR images. This is typically not a problem since prediction is linear in the number of data-points to be predicted, assuming that the classifier operates in a spatially local manner, which is certainly true for detection of small, spatially bounded objects such as small volcanoes or stars and galaxies). Even algorithms based on nearest neighbor prediction, which require the training set be kept on-line, are practical (assuming the training set is of size n, then for N >> n the complexity would still be O(N) for classifying the massive data sets).
3.1.2 Unsupervised Classification
A clustering problem (unsupervised learning) on the other hand, can easily be a daunting problem. A straightforward solution would seem to be to randomly sample the data set and build models from these random samples. This would only work if uniform random sampling is acceptable. In many cases, however, a stratified sample is required, in which case complexity of selection becomes a major issue.
In the SKICAT application, for example, uniform random sampling would simply defeat the entire purpose of clustering. Post-cataloging work on SKICAT focused on exploring the utility of clustering techniques to aid in scientific discovery. The basic idea is to search for clusters in the large data sets (millions to billions of entries in the sky survey catalog database). A new class of sky objects can potentially show up as a strong cluster that differs from the known objects, namely, stars and galaxies. Clustering algorithms serve to focus the attention of astronomers on potential new discoveries. These new classes are likely to have very low prior probability of occurrence in the data. For example, high-redshift quasars are some of the oldest objects in the Universe, but they occur with a frequency of about 100 per 107 objects. Relying primarily on the accurate classification of faint objects (a quasar is a faint star to begin with), and then clustering that population of objects, we have been able to produce lists of sky objects that are likely candidates to be high-redshift quasars. The astronomers then proceed to observe these objects with high-resolution instruments for verification. The observation is expensive as measured in effort, time, and equipment. We were able to help them help discover over 20 new quasars in the universe with 40 times less observation time as compared to efforts by other teams (Kenne ck et al. 1995).
When one is searching for new classes, it is clear that random sampling is not sufficient. Clearly, members of a minority class could completely disappear from any small (or not so small) sample. One approach that can be adopted here is an iterative sampling scheme which exploits the fact that using a constructed model to classify the data scales linearly with the number of data points to be classified. The procedure goes as follows:
- Generate a random sample S from the data set D.
- Construct a model MS based on S (based on probabilistic clustering or density estimation).
- Apply the model to the entire set D, classifying items in D in the clusters with probabilities assigned by the model MS .
- Accumulate all the residual data points (members of D that do not fit in any of the clusters of MS with high probability). Remove all data points that t in MS with high probability.
- If a sample of residuals of acceptable size and properties is collected, go to Step 7, else go to
- Let S be the set of residuals from Step 4, return to Step 1.
- Perform clustering on the accumulated set of residuals, look for tight clusters as candidate new discoveries of minority classes in the data.
Other schemes for iteratively constructing a useful small sample via multiple efficient passes on the data are also possible. The main idea is that sampling is not a straightforward matter. It has been noted that K-Means and mixture-model clustering algorithms can be quite sensitive to sample choice (Bradley, Fayyad and Reina 1998). In order to enable iterative refinement clustering algorithms (such as K-Means and EM) to operate over large database without the need for huge memory (RAM) requirements, scalable algorithms have been proposed that can cluster arbitrarily large databases in one (or less) scan of the database (Bradley, Fayyad and Reina 1998). In addition, solutions to the problem initializing such algorithms in the context of massive databases have also been developed (Bradley and Fayyad 1998).
3.2 Database Issues and Massive Data Sets
Interacting with a massive data set is different from dealing with a few small files. Issues of data management and scalable approaches to manipulating and analyzing the data are of paramount importance. The field of database systems has been studying these problems in detail for many decades. With the success and proliferation of database systems, it becomes important to consider issues of integration of data analysis techniques with databases. This integration falls within a rapidly growing research area known as data mining and knowledge discovery (Piatetsky-Shapiro, Fayyad and Smyth 1996, Glymour et al. 1997). It is important to understand that viewed from the perspective of data owners, the issue of how the data are stored and the details of statistical analysis techniques are not the primary concerns. A planetary geologist or a solar physicist is really interested in the analysis of the catalog and not in the details of the database or the statistical algorithms.
Ultimately most large scientific data sets are likely to be stored in database systems. Hence, from the perspective of convenience and integration, many of the basic operations of data processing, transformation, and modeling and analysis to produce analyzable catalogs should be all integrated within a convenient system. Approached systematically, many of the issues which hamper effective data analysis on massive data sets can become more tractable, including:
- Obtaining a valid random sample from the data efficiently.
- Efficiently gathering sufficient statistics from the data or subsets of it.
- Deriving (parametrizing) models from the data.
- Applying models to the data.
- Creating new views of the data that involve joining multiple tables.
- Querying the data to verify, refute, or validate hypotheses.
All of the above are fundamental database-intensive operations. It is unfortunate that current database systems do not make it very convenient to perform these operations in a science data analysis context. Fortunately, this situation is rapidly changing. Statisticians have a great opportunity to contribute to this change in fundamental ways. This requires understanding that data organization concepts are an essential component of massive data analysis and being sensitive to issues of data access and manipulation.
As an example, when we first started work on the SKICAT project, we started with our own “database” management scheme. After a few hundred thousand objects (only part of one plate) were produced, we realized that we were in trouble. We then switched to a statistical data analysis system with built-in database operations. However, after we processed two plates and had over a million objects to manage, the \database” system in the statistical package was hitting its limits. At that stage, we faced reality and bought a commercial industrial strength database product. While initially it caused added overhead in data access, the long-term payoff was tremendous when we had a few tens of millions of objects to query and model. In the database arena these aspects are getting increasing attention under names such as data warehousing, on-line analytical processing (OLAP), and data mining (Chaudhuri and Dayal 1997, Fayyad and Stolorz 1997).
3.3 Human Factors: The Interactive Process of Data Analysis
There is a strong tendency in the artificial intelligence and pattern recognition communities to try to build fully automated data analysis systems. However, in reality, fitting models to data tends to be an interactive, iterative, human-centered process for most large-scale problems of interest. In particular, the scientific discovery process is inherently human-centered (Valdes-Perez, 1999). In both the POSS-II and Magellan-SAR projects a large fraction of time was spent on understanding the problem domains, finding clever ways to preprocess the data, and interpreting the scientific significance of the results. Traditional statistical methodology focuses on solving precise mathematical questions, whereas the art of data analysis in practical situations demands considerable skill and time-investment in the formulation of the appropriate questions in the first place. In a recent paper Hand (1994) discusses this issue at length, while in a machine learning context the same point has also been widely recognized (Brodley and Smyth 1997, Saitta and Neri 1998). This issue of statistical strategy is even more relevant for massive data sets where the number of data points and the potentially high-dimensional representation of the data dramatically increases the branching factor in terms of modeling options.
A related point is that probabilistic modeling (and Bayesian methodologies in particular) can be quite difficult for non-specialists in statistics, which includes most scientists. The principles of multivariate and spatial statistical modeling are still relatively unknown to many scientists, whose knowledge of statistics is often based on undergraduate course-work and relatively rudimentary hypothesis testing procedures. Useful statistical solutions (algorithms and procedures) cannot be developed in complete isolation from their intended use. As more and more scientists become \data owners,” there is an ever-greater need to place appropriate and usable model-building tools in the hands of these new owners.
3.4 Subjective Human Annotation of Data Sets for Classification Purposes
For scientific data, performance evaluation is often subjective in nature since there is frequently no “gold standard.” As an example consider the volcano detection problem: there is no mechanism at present to independently verify if any of the objects which appear to look like volcanoes in the Magellan-SAR imagery truly represent volcanic edifices on the surface of the planet. The best one can do is harness the collective opinion of the expert planetary geologists on subsets of the data. One of the more surprising aspects of the volcano project was the realization that image interpretation (even by experts) can be highly variable and highly subjective. We have estimated that geologists are at best only about 80% accurate when labeling volcanoes (Smyth 1996). This fundamentally limits the amount of information one can reliably extract from the data. This degree of subjectivity is not unique to volcano-counting. For example, in the previously mentioned project involving automated analysis of sunspots in daily images of the Sun, there is also to be a significant degree of subjectivity and variation between scientists in terms of their agreement. While some statistical methodologies exist for handling subjective opinions of multiple experts (Ueber- sax 1993), there appears to be room for much more work on this problem of modeling the “noisy” human classification process in a scientific context.
3.5 Effective Use of Prior Knowledge
A popular (and currently resurgent) approach to handling prior information in statistics is
the Bayesian inference philosophy. Provided one can express one’s knowledge in the form of suitable prior densities, and given a likelihood function for the observed data, one then can proceed to obtain the posterior (whether by analytic or approximate means). However, in practice, the Bayesian approach can be difficult to implement effectively, particularly in complex problems such as those involving spatial data structures. For example, while there is a wealth of knowledge available concerning the expected size, shape, and appearance of Venusian volcanoes, it is quite difficult to translate this high-level information into precise quantitative models for use at the pixel-level. Pixel-level prior models, such as Markov random fields, are useful for quantifying “low-level” pixel correlations but are relatively weak at expressing higher-level knowledge about shape and geometry. In effect there is a gap between the language used by the scientist (which for volcanoes is typically phrased in terms of morphology) and the pixel representation of the data. A promising step here is the explicit use of high-level priors on object shapes, combined with observation models for the pixel data, all within a coherent statistical framework (Christensen, Rabbitt and Miller 1994, Dryden and Mardia 1998). However, there is certainly a need for more interactive “interviewing” tools which could elicit prior information from the user and automatically construct “translators” between the user’s language and the data representation. This is clearly related to the earlier point on modeling statistical strategy as a whole, rather than focusing only on algorithmic details.
3.6 Dealing with High Dimensionality
Massiveness has two aspects to it: the number of data points and their dimensionality. Most traditional approaches in statistics and pattern recognition do not deal well with high dimensionality. From a classification viewpoint the key is effective feature extraction and dimensionality reduction. The SKICAT application is an example of manual feature extraction followed by greedy automated feature selection. The Venus application relies entirely on a reduction from high-dimensional pixel space to a low dimensional principal component-based feature space. However, finding useful low-dimensional representations of high-dimensional data is still something of an art, since any particular dimension reduction algorithm inevitably performs well on certain data sets and poorly on others. A related problem is that frequently the goals of a dimension reduction step are not aligned with the overall goals of the analysis, e.g., principal components analysis is a descriptive technique which is widely used in scientific data analysis (for example, in atmospheric science (Wilks 1995) but it does not necessarily help with classification or cluster identification.
3.7 How Do the Data Grow?
An important issue to consider with massive data sets is whether massive data sets are more complex at some fundamental level than familiar “smaller” datasets. It is rare for large collections of data to consist of independent and identically distributed (IID) observations drawn from a fixed underlying probability distribution. A large observational data set is often collected over a long period of time, and can incorporate a mix of data from varied sources. Information on the origins of the data is often not tracked. The underlying data-generating phenomena can be changing over time. Evidence of this problem is manifested in massive data sets as follows: as the size of the data set increases, so do the sizes (as measured by complexity) of the models required to accurately model it.
In certain scientific data sets this phenomenon may not be as problematic in that many of the causes of variation in the data can be modeled and corrected for. In SKICAT, CCD images were used as a calibration set to map the intensity levels in different plates to a single global scale. Of course, since a survey happens over years, the technology underlying the data capturing mechanism (film) could improve during the data gathering, and similarly for data scanning operations as the hardware and software improves (or degrades). With many remote sensing data sets, the data are collected for general observation purposes, and may then be used to study unanticipated phenomena. For example, low readings of ozone over the polar regions were initially dismissed as sensor problems and corrected or labeled as corrupted 1.
4 Concluding Remarks
The proliferation of large scientific data sets within NASA has accelerated the need for more sophisticated data analysis procedures for science applications. This paper has briefly discussed several recent projects at JPL involving automated cataloging of large image data sets. The issues of complexity, statistical strategy, subjective annotation, prior knowledge, and high dimensionality were discussed in the general context of data analysis for massive data sets. In particular, the human role in the overall data-analysis process is seen to be critical. Thus, the development of interactive, process-oriented, interpretable statistical tools for fitting models to massive data sets appears to be a worthwhile direction for future research in the context of scientific data analysis.
Serious challenges exist to current paradigms for statistical data analysis in the context of massive data sets. Addressing these challenges and limitations, even partially, could go a long way in getting more tools in the hands of \data-owners” Ultimately the goal is to enable the end-user, the scientist, to easily and conveniently use these tools.
In conclusion, we point out that although our focus has been on science-related applications, massive data sets are rapidly becoming commonplace in a wide spectrum of activities including healthcare, marketing, finance, banking, engineering, retail, and many other fields. A new area of research, bringing together techniques and communities from a variety of fields including statistics, machine learning, pattern recognition, and databases, is emerging under the name of data mining and knowledge discovery in databases (KDD) (Piatetsky-Shapiro, Fayyad and Smyth 1996, Fayyad and Stoloz 1997). How to scale statistical inference and evaluation techniques up to very large data sets is one of the core research challenges in this developing field.
Acknowledgements
The SKICAT work is a collaboration between U. Fayyad (Microsoft, JPL), N. Weir and S. Djorgovski (Caltech Astronomy). The work on Magellan-SAR is a collaboration between Fayyad and Smyth (UC Irvine, JPL), M.C. Burl and P. Perona (Caltech E.E.) and the domain scientists: J. Aubele and L. Crumpler, Department of Geological Sciences, Brown University. Major funding for both projects has been provided by NASA’s Oce of Space Access and Technology (Code X). Thanks to Paul Stolorz for the updated summary of current work at JPL in Section 2.3. The work of P. Smyth was supported in part by NSF Grant IRI-9703120. The work described in this paper was carried out in part by the Jet Propulsion Laboratory, California Institute of Technology, under a contract with the National Aeronautics and Space Administration.
Aubele, J. C. and Slyuta, E. N. (1990), “Small domes on Venus: characteristics and origins,” Earth, Moon and Planets, 50/51, 493-532.
Barclay, T., R. Eberl, J. Gray, et al. (1998), “The Microsoft TerraServer,” Microsoft Research Report MSR-TR-98-17, Redmond, WA.
Blender, R., K. Fraedrich, and F. Lunkeit (1997), “Identification of cyclone track regimes in the North Atlantic,” Q. J. R. Meteorol. Soc., 123, 727-741.
Breiman, L., J.H. Friedman, R.A. Olshen, and C.J. Stone (1984), Classification and Regression Trees, Monterey, CA: Wadsworth & Brooks.
Bradley, P. and U. Fayyad (1998), “Refining initial points for K-Means clustering,” Proc. 15th International Conf on Machine Learning, Morgan Kaufmann.
Bradley, P., U. Fayyad, and C. Reina (1998), “Scaling clustering algorithms to large databases,” Proc. 4th International Conf. on Know ledge Discovery and Data Mining (KDD98), Menlo Park, CA: AAAI Press.
Brodley, C. and P. Smyth (1997) “Applying classification algorithms in practice,” Statistics and Computing, 7(1), 45-56.
Burl, M. C., U.M. Fayyad, P. Perona, P. Smyth, and M.P. Burl (1994), “Automating the hunt for volcanoes on Venus,” in Proceedings of the 1994 Computer Vision and Pattern Recognition Conference, CVPR-94, Los Alamitos, CA: IEEE Computer Society Press, pp.302-309.
Burl, M. C., L. Asker, P. Smyth, U. M. Fayyad, P. Perona, L. Crumpler, and J. Aubele (1998) “Learning to recognize volcanoes on Venus,” Machine Learning, 30(2{3), 165-194.
Burl, M. C., M. Weber, T.K. Leung, and P. Perona (in press), “Recognition of visual object classes,” in From Segmentation to Interpretation and Back: Mathematical Methods in Computer Vision, Springer-Verlag.
Cattermole, P. (1994), Venus: The Geological Story, Baltimore, MD: Johns Hopkins University Press.
Chaudhuri, S. and U. Dayal (1997), “An overview of data warehousing and OLAP technology,” ACM SIGMOD RECORD, March’97 issue, Association for Computing Machinery.
Chaudhuri, S., U. M. Fayyad, and J. Bernhardt (1999), “Scalable classification over SQL databases,” Proc. of International Conference on Data Engineering (ICDE-99)., Los Alamitos, CA: IEEE Press.
Cheng, X. and J. M. Wallace (1993), “Cluster analysis of the Northern Hemisphere wintertime 500-hPa height field: Spatial patterns,” J. Atmos. Sci., 50, 2674-2696.
Christensen, G. E., R. D. Rabbitt, and M. I. Miller (1994), “3D Brain mapping using a deformable neuroanatomy,” Physics in Medicine and Biology, 39, 609-618.
Glymour, C., D. Madigan, D. Pregibon, and P. Smyth (1997), “Statistical themes and lessons for data mining,” Data Mining and Knowledge Discovery, vol.1, no. 1.
Djorgovski, S.G., N. Weir, and U .M. Fayyad (1994), “Processing and analysis of the Palomar – STScI digital sky survey using a novel software technology,” in D. Crabtree, R. Hanisch, and J. Barnes (Eds.), Astronomical Data Analysis Software and Systems III, A.S.P. Conf. Ser. 61, 195.
Dryden, I. L. and K. V. Mardia (1998), Statistical Shape Analysis, New York: Wiley.
Duda, R. O. and P. E. Hart (1973), Pattern Classification and Scene Analysis. New York: John Wiley and Sons.
Fasman, K. H., A. J. Cuticchia, and D. T. Kingsbury (1994), “The GDB human genome database anno 1994,” Nucl. Acid. Res., 22(17), 3462-3469.
Fayyad, U. M. and K.B. Irani (1993), “Multi-interval discretization of continuous-valued attributes for classification learning,” In Proc. of the Thirteenth Inter. Joint Conf. on Artificial Intelligence, Palo Alto, CA: AAAI Press.
Fayyad, U. M. (1994), “Branching on attribute values in decision tree generation,” in Proc.
of the Twelfth National Conference on Artificial Intelligence AAAI-94, pages 601-606, Cambridge, MA: MIT Press.
Fayyad, U. M., N. Weir, and S.G. Djorgovski (1993), “SKICAT: a machine learning system for automated cataloging of large scale sky surveys,” Proc. of the Tenth International Conference on Machine Learning, pp. 112-119, San Mateo, CA: Morgan Kaufmann.
Fayyad, U. M., S.G. Djorgovski, and N. Weir (1995), “Automating analysis and cataloging of sky surveys,” in Advances in Know ledge Discovery and Data Mining, U. Fayyad, G. Piatetsky Shapiro, P. Smyth, & R. Uthurusamy (Eds.), Cambridge, MA: MIT Press.
Fayyad, U. M., G. Piatetsky-Shapiro, and P. Smyth (1996), “From data mining to knowledge discovery: an overview,” in Advances in Knowledge Discovery and Data Mining, U. Fayyad, G. Piatetsky-Shapiro, P. Smyth, & R. Uthurusamy (Eds.), Cambridge,MA: MIT Press.
Fayyad, U. M. and P. Stolorz (1997), “Data mining and KDD: promise and challenges,” Future Generation Computer Systems (13)2-3, pp. 99-115.
Gaffney, S. and P. Smyth (1999), “Trajectory clustering using mixtures of regression models,” Proceedings of the 1999 SIGKDD Conference on Know ledge Discovery and Data Mining, ACM Press, in press.
Geman, S., E. Bienenstock, and R. Doursat (1992), “Neural networks and the bias-variance dilemma,” Neural Computation, 4, 1-58.
Guest, J. E., et al. (1992), “Small volcanic edifices and volcanism in the plains of Venus,” Journal of Geophysical Research, vol.97, no.E10, pp.15949-66.
Hand, D. J. (1994), “Deconstructing statistical questions,” J. R. Statist. Soc. A, 157(3), pp.317-356.
Head, J. W. et al (1991), “Venus volcanic centers and their environmental settings: recent data from Magellan,” American Geophysical Union Spring meeting abstracts, EOS 72:175.
Jarvis, J. and A. Tyson (1981), “FOCAS: faint object classification and analysis system,” Astronomical Journal 86, 476.
Magellan at Venus: Special Issue of the Journal of Geophysical Research, American Geo-physical Union, 1992.
Kennefick, J. D., R. R. de Carvalho, S. G. Djorgovski, M. M. Wilber, E. S. Dickson, N. Weir, U. M. Fayyad, and J. Roden (1995), “The discovery of five quasars at z>4 using the second Palomar sky survey,” Astronomical Journal, vol. 110, no. 1: 78-86.
Saitta, L. and F. Neri (1998) “Learning in the real world,” Machine Learning, 30, 133{163.
NSSDC News, December 1998 , available online at http://nssdc.gsfc.nasa.gov/nssdc news/.
Quinlan, J. R. (1986), “The induction of decision trees,” Machine Learning, 1(1).
Saunders, R. S. et al (1992) “Magellan mission summary,” Journal of Geophysical Research, vol.97, no. E8, pp.13067-13090.
Science, special issue on Magellan data, April 12, 1991.
Shafer, J. C., R. Agrawal, and M. Mehta (1996), “SPRINT: a scalable parallel classifier for data mining,” Proc. of 22nd international Conference on Very Large Databases (VLDB-96), San Francisco, CA: Morgan Kaufmann.
Smyth, P. (1996) “Bounds on the mean classification error rate of multiple experts,” Pattern Recognition Letters, 17, 1253{1257.
Smyth, P., M. C. Burl, U. M. Fayyad, P. Perona (1996), “Knowledge discovery in large image databases: dealing with uncertainties in ground truth,” in Advances in Knowledge Discovery and Data Mining, U. M. Fayyad, G. Piatetsky-Shapiro, P. Smyth, R. Uthurasamy (eds.), pp.517-539. Cambridge, MA: MIT Press.
Smyth, P., K. Ide, and M. Ghil (in press), “Multiple regimes in Northern hemisphere height fields via mixture model clustering,” J. Atmos. Sci.
Stolorz, P. et al. (1995), “Fast spatio-temporal data mining of large geophysical datasets”. In Proceedings of the First International Conference on Know ledge Discovery and Data Mining, U. M. Fayyad and R. Uthurasamy (eds.), pp.300-305. Menlo Park, CA: AAAI Press.
Stolorz, P. and P. Cheeseman (1998), “Onboard science data analysis: applying data mining to science-directed autonomy,” IEEE Intelligent Systems, September/October 1998, pp.62-68.
Turmon, M., J. Pap and S. Mukhtar (1997), “Bayesian inference for identifying solar active regions,” Proceedings Third International Conference on Knowledge Discovery and Data Mining, Menlo Park, CA: AAAI Press.
Turmon, M. (1997), “Identification of solar features via Markov random fields,” Proceedings Second Meeting of International Association for Statistical Computing (IASC-2).
Turmon, M. and S. Mukhtar (1998), “Representing solar active regions with triangulations,” in Proceedings in Computational Statistics, COMPSTAT-98, R. Payne and P. Green (eds), Physica-Verlag, pp 473-478.
Uebersax, J. S. (1993), “Statistical modeling of expert ratings on medical treatment appropriateness,” J. Amer. Statist. Assoc., vol.88, no.422, pp.421-427.
Valdes, F. (1982) “The resolution classifier,” in Instrumentation in Astronomy IV, volume 331:465, Bellingham, WA, SPIE.
Valdes-Perez, R. E. (1999) “Principles of human computer collaboration for knowledge discovery in science,” Artificial Intelligence, 107(2), 335-346.
Weir, N., U. M. Fayyad, and S. G. Djorgovski (1995), “Automated star/galaxy classification for digitized POSS-II,” The Astronomical Journal, vol. 109, no. 6: 2401-2414.
Weir, N., S. G. Djorgovski, and U. M. Fayyad (1995), “Initial Galaxy Counts From Digitized POSS-II,” Astronomical Journal, vol. 110, no. 1: 1-20.
Wilks, D. S. (1995), Statistical Methods in the Atmospheric Sciences, San Diego: Academic Press.
Wilson, G. S. and P.W. Backlund (1992), “Mission to Planet Earth,” Photo. Eng. Rem. Sens., 58(8), 1133-1135.