
1 Introduction
Data Mining and Knowledge Discovery in Databases (KDD) are rapidly evolving areas of research that are at the intersection of several disciplines, including statistics, databases, pattern recognition/AI, optimization, visualization, and high-performance and parallel computing. The increased recent attention is primarily because many more people now have “databases”. This is turn is driven by two factors: the ever decreasing cost of computers and storage media, and the success of database systems in becoming a mainstay of many activities in business, science, and government.
With the widespread use of databases and the explosive growth in their sizes, individuals and organizations are faced with the problem of making use of this data. Traditionally, “use” of data has been limited to querying a reliable store via some well-circumscribed application or canned report-generating entity. While this mode of interaction is satisfactory for a wide class of well-defined processes, it was not designed to support data exploration, decision support applications, and ad hoc querying of the data.
Now that capturing data and storing it has become easy and inexpensive, certain questions begin to naturally arise: Will this data help my business gain an advantage? How can we use historical data to build models of underlying processes that generated such data? Can we predict the behavior of such processes? How can we “understand” the data? These questions become particularly important in the presence of massive data sets. A large database represents a large body of information that is presumed to be valuable since it records vital measurements, be it a business venture, a scientific endeavor, or the operations of a government entity. Yet frequently, this potentially valuable data resource is far from being effectively accessible. The current interfaces between humans and storage systems do not support navigation, exploration, summarization, or modeling of large databases. Providing these types of capabilities and more is the goal of the emerging research area of Data Mining and Knowledge Discovery in Databases.
1.1 From OLTP to Decision Support
While transactional systems provide effective solutions to the problems of reliable logging, book-keeping, availability, and recovery, there has been little emphasis on supporting summarization, aggregation, and ad hoc querying over transactional stores. A recent wave of activity in the database field, called data warehousing, has been concerned with turning transactional data into more traditional relational databases that can be queried for summaries and aggregates of transactions. Data warehousing also includes the integration of multiple sources of data along with handling the host of problems associated with such an endeavor. These problems include: dealing with multiple data formats, multiple database management systems (DBMS), distributed databases, unifying data representation, data cleaning, and providing a unified logical view of an underlying collection of non-homogeneous databases.
Data warehousing is the first step in transforming a database system from a system whose primary purpose is reliable storage to one whose primary use is decision support. A closely related area is called On-Line Analytical Processing (OLAP) [6]. The current emphasis of OLAP systems is on supporting query-driven exploration of the data warehouse. Part of this entails pre-computing aggregates along data “dimensions” in the multi-dimensional data store. Because the number of possible aggregates is exponential in the number of “dimensions”, much of the work in OLAP systems is concerned with deciding which aggregates to pre-compute and how to derive other aggregates (or estimate them reliably) from the pre-computed projections. There are also very interesting questions to be answered regarding how much of the cube to materialize, how to represent it and access it, and which dimensions should be chosen for aggregation since it is not possible to build a cube on all available fields.
1.2 Why Data Mining?
In the OLAP framework, the analysis and exploration is driven entirely by the human analyst. Hence, OLAP may be viewed as extending the SQL querying framework to accommodate queries that if executed on a relational DBMS would be computationally prohibitive. Unlike OLAP, data mining techniques allow for the possibility of computer-driven exploration of the data. This opens up the possibility for a new way of interacting with databases: specifying queries at a much more abstract level than SQL permits. It also facilitates data exploration for problems that, due to high-dimensionality, would otherwise be very difficult to explore by humans, regardless of difficulty of use of, or efficiency issues with, SQL.
A problem that has not received much attention in database research is the query formulation problem: how can we provide access to data when the user does not know how to describe his goal in terms of a specific query?
Examples of this situation are fairly common in decision support situations. For example, in a business setting, say a credit card or telecommunications company would like to query its database of usage data for records representing fraudulent cases. In a science data analysis context, a scientist dealing with a large body of data would like to request a catalog of events of interest appearing in the data. Such patterns, while recognizable by human analysts on a case by case basis are typically very difficult to describe in a SQL query or even as a computer program in a stored procedure. A more natural means of interacting with the database is to state the query by example. In this case, the analyst would label a training set of cases of one class versus another and let the data mining system build a model for distinguishing one class from another. The system can then apply the extracted classifier to search the full database for events of interest. This is typically easier because examples are usually readily available, and humans find it natural to interact at the level of cases.
Another major problem which data mining could help alleviate is that humans find it particularly difficult to visualize and understand a large data set. Data can grow along two dimensions: the number of fields (also called dimensions or attributes) and the number of cases. Human analysis and visualization abilities do not scale to high-dimensions and massive volumes of data. A standard approach to dealing with high-dimensional data is to project it down to a low-dimensional space and attempt to build models in this simplified subspace. As the number of dimensions grow, the number of choice combinations for dimensionality reduction explode. Furthermore, a projection to lower dimensions could easily transform a relatively easy discrimination problem into one that is extremely difficult. In fact, some mining algorithms (e.g. support vector machines [26]) employ a reverse technique where dimensionality is purposefully increased to render the classification problem easy (linear).
However, even if one is to accept that dimensionality reduction is necessary if exploration is to be guided by a human, this still leaves a significant projection selection problem to solve. It is infeasible to explore all of the ways of projecting the dimensions or selecting the right subsamples (reduction along columns and rows). An effective means to visualize data would be to employ data mining algorithms to perform the appropriate reductions. For example, a clustering algorithm could pick out a distinguished subset of the data embedded in a high-dimensional space and proceed to select a few dimensions to distinguish it from the rest of the data or from other clusters. Hence a much more effective visualization mode could be established: one that may enable an analyst to find patterns or models that may otherwise remain hidden in the high-dimensional space.
Another factor that is turning data mining into a necessity is that the rates of growth of data sets exceed by far any rates with which traditional “manual” analysis techniques could cope. Hence, if one is to utilize the data in a timely manner, it would not be possible to achieve this goal in the traditional data analysis regime. Effectively this means that most of the data would remain unused. Such a scenario is not realistic in any competitive environment where those who better utilize data resources will gain a distinct advantage. This sort of pressure is present in a wide variety of organizations, spanning the spectrum from business, to science, to government. It is leading to serious reconsideration of data collection and analysis strategies that are nowadays causing the accumulation of huge “write-only” data stores.
2 KDD and Data Mining
The term data mining is often used as a synonym for the process of extracting useful information from databases. In this paper, as in [9], we draw a distinction between the latter, which we call KDD, and “data mining”. The term data mining has been mostly used by statisticians, data analysts, and the database communities. The earliest uses of the term come from statistics and its usage in most settings was associated with negative connotations of blind exploration of data without a priori hypotheses to be verified. However, notable exceptions can be found. For example, as early as 1978 [16], the term is used in a positive sense in a demonstration of how generalized linear regression can be used to solve problems that are very difficult for humans and the traditional statistical techniques.
The term KDD was coined at the first KDD workshop in 1989 [20] to emphasize that “knowledge” is the end product of a data-driven discovery. In our view, KDD refers to the overall process of discovering useful knowledge from data while data mining refers to a particular step in this process. Data mining is the application of specific algorithms for extracting patterns from data. The additional steps in the KDD process, such as data preparation, data selection, data cleaning, incorporating appropriate prior knowledge, and proper interpretation of the results of mining, are essential to ensure that useful knowledge is derived from the data. Blind application of data mining methods (rightly criticized as “data dredging” in the statistical literature) can be a dangerous activity easily leading to discovery of meaningless patterns.
We give an overview of the KDD process in Figure 1. Note that in the KDD process, one typically iterates many times over previous steps and the process is fairly messy with plenty of experimentation. For example, one may select, sample, clean, and reduce data only to discover after mining that one or several of the previous steps need to be redone. We have omitted arrows illustrating these potential iterations to keep the figure simple.
We adopt the definitions of KDD and Data mining provided in [9] as follows:
Knowledge Discovery in Databases: is the process of identifying valid, novel, potentially useful, and ultimately understandable structure in data. Here, data is a set of facts (cases in a database) and structure refers to either patterns or models. A pattern is an expression representing a parsimonious description of a subset of the data. A model is a representation of the source generating the data. The term process implies that KDD is comprised of many steps (Figure 1) which involve data preparation, search for patterns, knowledge evaluation, and refinement, all potentially repeated in multiple iterations.
Data Mining: is a step in the KDD process that, under acceptable computational efficiency limitations, enumerates structures (patterns or models) over the data. There are many (potentially infinitely) more patterns/models over a finite data set than there are data records. To be deemed knowledge, the derived structure must pass certain criteria. Notions of utility and validity have classical definitions in decision analysis and statistics. While it is possible to define quantitative measures for certainty (e.g., estimated prediction accuracy on new data) or utility (e.g. gain, perhaps in dollars saved due to better predictions or speed-up in response time of a system), notions such as novelty and understandability are much more subjective and difficult to define. In certain contexts understandability can be estimated by simplicity (e.g., the number of bits to describe a pattern). Sometimes the measures are combined under a single interestingness measure (e.g., see [23] and references within). Interestingness functions can be explicitly defined or can be manifested implicitly via an ordering placed by the KDD system on the discovered patterns or models. The term knowledge in KDD is user-oriented, domain-specific, and determined by the interestingness measure; it is not a general (e.g. philosophical) definition. 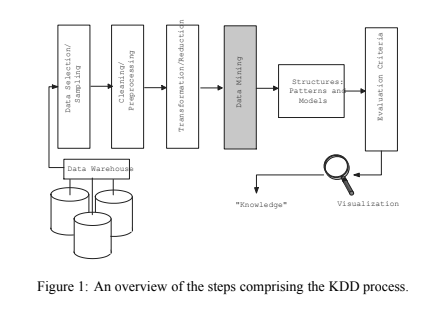 The data mining component of the KDD process is concerned with the algorithmic means by which patterns are extracted and enumerated from data. The overall KDD process (Figure 1) includes the evaluation and possible interpretation of the “mined” patterns to determine which patterns may be considered new “knowledge.”
3 Data Mining Methods: An Overview
Data mining techniques can be divided into five classes of methods. These methods are listed below. While many of these techniques have been historically defined to work over memory-resident data and not much attention has been given to integrating them with database systems, some of these techniques are beginning to be scaled to operate on large databases. Examples in classification (Section 3) include decision trees [18], in summarization (Section 3) association rules [1], and in clustering [28]
Predictive Modeling
The goal is to predict some field(s) in a database based on other fields. If the field being predicted is a numeric (continuous) variable (such as a physical measurement of e.g. height) then the prediction problem is a regression problem. If the field is categorical then it is a classification problem. There is a wide variety of techniques for classification and regression. The problem in general is to determine the most likely value of the variable being predicted given the other fields (inputs), the training data (in which the target variable is given for each observation), and a set of assumptions representing one’s prior knowledge of the problem.
Linear regression combined with non-linear transformation on inputs could be used to solve a wide range of problems. Transformation of the input space is typically the difficult problem requiring knowledge of the problem and quite a bit of “art”. In classification problems, this type of transformation is often referred to as
“feature extraction”.
In classification, the basic goal is to predict the most likely state of a categorical variable (the class). This is fundamentally a density estimation problem. If one can estimate the probability that the class C = c, given the other fields X = x for some feature vector x, then one could derive this probability from the joint density on C and X. However, this joint density is rarely known and very difficult to estimate. Hence, one has to resort to various techniques for estimating. These techniques include:
- Density estimation, e.g. kernel density estimators [7, 22] or graphical representations of the joint density [14].
- Metric-space based methods: define a distance measure on data points and guess the class value based on proximity to data points in the training set. An example is the K-nearest-neighbor method [7].
- Projection into decision regions: divide the attribute space into decision regions and associate a prediction with each. For example, linear discriminant analysis finds linear separators, while decision tree or rule-based classifiers make a piecewise constant approximation of the decision surface. Neural nets find non-linear decision surfaces.
Clustering
Also known as segmentation, clustering does not specify fields to be predicted but targets separating the data items into subsets that are similar to each other. Since, unlike classification, we do not know the number of desired “clusters”, clustering algorithms typically employ a two-stage search: An outer loop over possible cluster numbers and an inner loop to fit the best possible clustering for a given number of clusters. Given the number k of clusters, clustering methods can be divided into three classes:
- Metric-distance based methods: a distance measure is defined and the objective becomes finding the best k-way partition such as cases in each block of the partition are closer to each other (or centroid) than to cases in other clusters.
- Model-based methods: a model is hypothesized for each of the clusters and the idea is to find the best fit of that model to each cluster. If M` is the model hypothesized for cluster `, (` 2 f1;:::;kg), then one way to score the fit of a model to a cluster is via the likelihood:
 The prior probability of the data D, Prob(D) is a constant and hence can be ignored for comparison purposes, while Prob(M` ) is the prior assigned to a model. In maximum likelihood techniques, all models are assumed equally likely and hence this term is ignored. A problem with ignoring this term is that models that are more complex are always preferred and this leads to overfitting the data.
 - Partition-based methods: basically, enumerate various partitions and then score them by some criterion. The above two techniques can be viewed as special cases of this class. Many AI techniques fall into this category and utilize ad hoc scoring functions.
Note again that the problem is fundamentally statistical in nature. If one had access to the joint probability density function governing the data source, then the problem of clustering becomes the problem of determining the “modes’ (maxima) in the density function. Hence, one approach is to estimate the density and then go “bump-hunting” [12]. Unfortunately, in high-dimensional data, neither density estimation (e.g. kernel-density estimation [22] nor bump-hunting are feasible [12]. Hence, methods within the above three classes are necessary.
Data Summarization
Sometimes the goal is to simply extract compact patterns that describe subsets of the data. There are two classes of methods which represent taking horizontal (cases) or vertical (fields) slices of the data. In the former, one would like to produce summaries of subsets: e.g. sufficient statistics, or logical conditions that hold for subsets. In the latter case, one would like to predict relations between fields. This class of methods is distinguished from the above in that the goal is to find relations between fields. One common method is called association rules [1]. Associations are rules that state that certain combinations of values occur with other combinations of values with a certain frequency and certainty. A common application of this is market basket analysis were one would like to summarize which products are bought with what other products. While there are exponentially many rules, due to data sparseness only few such rules satisfy given support and confidence thresholds. Scalable algorithms find all such rules in linear time (for reasonable threshold settings). While these rules should not be viewed as statements about causal effects in the data, they are useful for modeling purposes if viewed as frequent marginals in a discrete (e.g. multinomial) probability distribution. Of course to do proper inference one needs to know the frequent, infrequent, and all probabilities in between. However, approximate inference can sometimes be useful.
Dependency Modeling
Insight into data is often gained by deriving some causal structure within the data. Models of causality can be probabilistic (as in deriving some statement about the probability distribution governing the data) or they can be deterministic as in deriving functional dependencies between fields in the data [20]. Density estimation methods in general fall under this category, as do methods for explicit causal modeling (e.g. [13] and [14]).
Change and Deviation Detection
These methods account for sequence information, be it time-series or some other ordering (e.g. protein sequencing in genome mapping). The distinguishing feature of this class of methods is that ordering of observations is important. Scalable methods for finding frequent sequences in databases, while in the worst-case exponential in complexity, do appear to execute efficiently given sparseness in real-world transactional databases [17].
4 Discussion: Issues and Problems
The problem of mining data is not an easy one. The classes of data mining methods all include ill-posed problems: many solutions exist for a given problem, with no clear means of judging a solution’s quality. This is fundamentally different from the type of challenge faced with familiar well-defined problems like: sorting data, matching a query to records, joining two tables, or restoring a database.
Some degree of caution needs to be taken when approaching data mining problems. In this section, we shall consider a few examples of how these problems can manifest themselves in sometimes subtle ways. Hence, one needs to be careful to avoid the mines1 associated with data mining.
The Curse of Dimensionality
Data in higher dimensional spaces can behave in ways that are quite puzzling and counter-intuitive. Many examples can be found in the literature (for a good exposition see [11]). Notions on “neighborhood” that have a certain meaning, typically attached to “physical proximity”, in two and three dimensions, completely break down as one moves to higher dimensions. Let us consider a simple example: suppose that one is given a data set, and one knows that data in this data set is drawn from a mixture of two Gaussian distributions. Furthermore, assume
that the Gaussians are very simple: the covariance matrix is diagonal, and all diagonal entries are the same, say a value like 2.02. Intuitively, the data distributions look like two “spheres” in whatever dimensions the data are in, with “most” of the data appearing “closer” to the centers of the two spheres.
Now in the familiar one-dimensional case, one can safely say that the majority of the data in each Gaussian falls within a “distance” of one standard deviation (1-) of the mean of the Gaussian. Many readers are likely to be familiar with the fact that some 68% of the data falls within this interval. But now let us go to higher dimensions while preserving the same distribution. For dimensionality d = 12, how much of the data is within a Euclidean distance of 1- of the mean (center) of the Gaussian? The answer may surprise many: less than 1% of the data. In fact, if we let dimensionality go to d = 100, then there is practically no data “near” the mean (chance of an item falling anywhere within the sphere at the center with radius = 1- is < 1016). This means that essentially all of the data is “far” from the mean!. What significance do we attach to being “far” from the mean in this case?
Correlation versus Causality
Having access to a large amount of data, one may be tempted to attach special significance to correlation of events. For example, assume that one has found that in a set of supermarket transactions, the following associations are high: “buy(hot dogs) – buy(steak sauce)” and “buy(hamburger) – buy(steak sauce)”3. These associations might lead a store manager to conclude that hot dogs and hamburgers are causally linked to sales of steak sauce. In fact, the real reason for this correlation might be that generally people who like to eat meat, in all its varieties, also happen to buy more steak sauce than the general population.
Now suppose a sales manager, motivated to increase the sales of steak sauce, which happens to be a high profit margin item, decides to start a promotion designed to drive the sales of steak sauce. Perhaps giving away hot dogs might cause people to buy more steak sauce? Now in this example, basic common sense and the semantics of the items might prevent the manager from embarking on this lossy policy. However, often these correlations can link items in a store in relationships that might seem mysterious and intriguing. Situations under which correlation can lead to causality are not straightforward and are the subject of much study [13, 19].
Association rules can be viewed as an efficient and scalable means for finding frequent marginals in the data. However, the use of these marginals in probabilistic inference requires care, as the infrequent marginals can be just as important. For a related discussion, see [24].
Interestingness
Which patterns are likely to be interesting to the user? For example, suppose one is to run association rules over a demographics database containing age, sex, marital status, family conditions, etc. A strong association4 might take the form of a statement that essentially says: “With confidence better than 99%, in this database, all individuals who are husbands also happen to be males.” While this rule might strike many as trivial, it may actually have interesting side-effects. In this example, an interesting question is raised by the fact that the association does not hold with 100% confidence (due to errors in data cleaning). Furthermore, how should a machine decide that this association is less interesting than one that might be extremely informative, as in the next example.
Lest the reader be misled into thinking that association rules are not really interesting, I’ll quote an example from IBM’s data mining group. In one application to data from the Australian government healthcare agency, association rules found that there was a strong correlation between two billing codes charged by physicians to the government insurance. In this case, this was a double-billing practice and its detection is expected to save the government tens of millions of dollars. Note that evaluated purely on a syntactic basis, there is little reason to distinguish between this valuable association and the one about husbands being males above.
Model Complexity
In general, it should be pointed out that a model that perfectly fits the data (i.e. an apparently optimal solution) may be less desirable than one that does not fit the data. This is known as overfit or overspecialization. The problem of trading off the simplicity of a model with how well it fits the training data is a well-studied problem. In statistics this is known as the bias-variance tradeoff [11], in Bayesian inference it is known as penalized likelihood [2, 14], and in pattern recognition/machine learning it manifests itself as the minimum message length (MML) [27] problem. The MML framework, also called minimum description length (MDL) [21] dictates that the best model for a given data set is one that minimizes the coding length of the data and the model combined.
If a model fits the data exactly, the data need not be encoded and the cost is that of coding the model. If the data is not represented by a model, the cost is that of encoding the data. One can show that minimizing the MDL is equivalent to selecting the model that minimizes the Bayes risk assuming cost of errors is uniform, i.e. for a data set D, the MDL prefers the model M for which Prob(M/D) is maximized. This can be shown by a simple application of Bayes rule (see equation 1) which, after taking the logarithm of each side reduces to
![]() Noting that Prob(D) is a constant for all models being compared, and that the minimal cost of encoding an object requires at least logarithm of its probability in bits, we see that MDL is indeed calling for choosing the model with the maximum likelihood given the data. The lesson here is that a penalty must be paid if more complex models are used. The formula above gives the appropriate tradeoff. Of course, in many situations, determining the minimal encoding cost of a hypothesis and the data given the hypothesis may be just as difficult as the original problem of finding the best model.
Noting that Prob(D) is a constant for all models being compared, and that the minimal cost of encoding an object requires at least logarithm of its probability in bits, we see that MDL is indeed calling for choosing the model with the maximum likelihood given the data. The lesson here is that a penalty must be paid if more complex models are used. The formula above gives the appropriate tradeoff. Of course, in many situations, determining the minimal encoding cost of a hypothesis and the data given the hypothesis may be just as difficult as the original problem of finding the best model.
Enumerating a Plurality of Models
The enumeration of many patterns over data can be a dangerous activity. For example, assume one is given a database that happens to be generated completely randomly: i.e. there are no dependencies between fields and hence no models or patterns should be valid in this data, since by definition there are no regularities in it. However, because there are many more patterns/models possible than data points in a finite database, some patterns/models are likely to fit the data by pure chance. When testing many such models, it can be shown that with probability rapidly approaching 1.0, some pattern/model is likely to fit the data nicely. There are methods for adjusting for such random chance (e.g. Bonferroni adjustment) but these are not very effective. One needs to bear it mind when it is time to draw conclusions or summarize “knowledge” from the data.
5 Is There Any Hope?
The previous section could leave the reader in a state of doubt: with a path littered with so many explosive mines, is there any hope to data mining endeavors? The answer is a resounding yes. Indeed, many data mining activities have resulted in great results. For examples of applications in science data analysis, see [10] and in industry see [4]. The primary reasons for hope in data mining include:
Database Regularity. Most databases exhibit a good degree of regularity and do not approach the theoretically possible levels of “difficulty”. For example, consider data on user supermarket shopping, or equivalently people browsing web pages. While the space of all possible behavior is huge, extending from thousands to millions of dimensions, with as many cases (data points), most data on these processes exhibits a merciful dose of regularity. Real data typically occupies a very low dimensional subspace of the space of possible cases. Not only is the data extremely sparse, but frequent events are fairly clustered. This is evidenced by association rule algorithms that often run in linear time and almost never approach the theoretical worst-case behavior of exponential complexity.
Humans cannot process lots of data, especially in high-dimensional spaces. This renders alternative computational means for extracting a solution (e.g. data mining techniques), even if heuristic and suboptimal, of high value to users. The absence of a viable “manual” alternative makes any solution better than no solution.
Sufficient statistics to the rescue. Many algorithms for classification and clustering do not require direct access to the data, only to sufficient statistics about the data. Hence, even though most implementations of statistical techniques assume data is in memory, the usage of such data is typically limited to deriving the sufficient statistics from it. This observation suggests a nice decomposition between what a server needs to provide (data intensive operations to derive sufficient statistics) versus what a data mining “client” needs to do (consume sufficient statistics to build a model). This is likely to be a good direction towards scaling mining algorithms to effectively work with large databases. See [18, 5, 28, 3] for examples in classification and clustering.
Partitioning methods are suitable to large databases. Most data mining methods are essentially partitioning methods: find local partitions in the data and build a model for each local region. This is a particularly suitable model for large databases. Large databases grow over time, with the underlying data generating source changing properties over time. While most methods in statistics assume the data is governed by some static global model, partitioning based methods do cope well with such data, often better than humans or traditional statistical models (which attempt to fit a single model to the entire data).
Greedy heuristics seem to do just fine. Frequent experience is that greedy heuristic algorithm that examine one dimension at a time, locally ignoring interactions between dimensions, appear to perform nicely over real-world data sets. This surprising fact is responsible for many of the successes of data mining [10, 4].
Sampling can help. It may not be necessary or desirable to work over the entire contents of a large database. If the model being built is simple, then using lots of data may not be called for. Recall that if all one is doing is estimating the average value of a column, then a small sample of a few hundred points is more than sufficient, a few thousand is overkill. The value computed from a few thousand cases is virtually indistinguishable from one computed over millions of cases. Of course, some operations such as clustering may be more effective with larger samples, and sometimes getting the random sample does not buy one any advantages over operating on the entire database.
6 Concluding Remarks
Successful KDD applications continue to appear, driven mainly by a glut in databases that have clearly grown to surpass raw human processing abilities. For examples of success stories in commercial applications see [4] and in science analysis see [10]. More detailed case studies are found in [8]. Scalable methods for decision trees, clustering, nearest neighbor, and density estimation have been developed and can work with very large databases.
The fundamental problems of data analysis and how to mechanize it are fairly difficult. Scaling mining methods to work efficiently on large databases involves considering issues of limited main memory, efficient indexing structures, and effective sampling methods tightly coupled to model construction. Issues of representing meta-data (information of data lineage, transformations, and properties) and its use in data cleaning, mining, and visualization and mining distributed stores where data movement between client and server must be minimized are important challenges. Often mining is desirable over non-homogenous data sets (including mixtures of multimedia, video, and text modalities); current methods assume fairly uniform and simple data structure.
While operating in a very large sample size environment is a blessing against overfitting problems, data mining systems need to guard against fitting models to data by chance. This problem becomes significant as an algorithm explores a huge search space over many models for a given data set. Also, traditional statistical methods for assessing significance were not formulated to operate in large sample environments. If one has lots of data, then almost all “events” become statistically significant. For purposes of visualization and reporting, proper tradeoffs between complexity and understandability of models are needed. Finally, an important challenge is to develop theory and techniques to model growth and change in data. Large databases, because they grow over a long time, do not grow as if sampled from a static probability density. The question of how does the data grow? needs to be better understood; see articles by P. Huber, by Fayyad and Smyth, and by others in [15]. For a more extensive list of research problems in data mining and KDD, the reader is referred to the Editorials of issues 1:1 and 2:2 of the journal: Data Mining and Knowledge Discovery. These are accessible on-line at http://research.microsoft.com/datamine. Interested readers will also find links to many related web sites there.
Data mining and KDD are inherently interdisciplinary fields, and meaningful advances will require using techniques from a variety of fields. An examination of the literature on data mining techniques in different communities quickly reveals many problems arising from the fact that the various constituent communities do not interact closely. Techniques developed in statistics typically pay little to no attention to questions of scale, dealing with database issues, and restricted access to data. Approaches from the database community are often lacking on the statistical side, sometimes with fairly blatant violations of basic statistical principles. Techniques developed in the data visualization community are typically divorced from data mining or database issues. Visualization techniques exist to visualize a few dimensions effectively (sometimes up to 10 dimensions), but little attention is paid to which dimensions out of the hundreds/thousands possible, and which of the exponentially many possible combinations of dimensions, are to be chosen for visualization. Techniques from optimization theory and mathematical programming often ignore both database and statistical issues.
It is my hope that the emerging new field of Data Mining and KDD will bring together the proper mix of techniques, to bring us closer to the ultimate goal: enabling the effective use of large stores and allowing us to derive value from our capability to store large amounts of data. It may be instructive to take a global view of where we stand today in terms of our ability to understand, navigate, and exploit the digital information universe we now find ourselves embedded in. If I were to draw on a historical analogy of where we stand today with regards to digital information manipulation, navigation, and exploitation, I find myself thinking of Ancient Egypt. We can build large impressive structures. We have demonstrated abilities at the grandest of scales in being able to capture data and construct huge data warehouses. However, our ability to navigate the digital stores and truly make use of their contents, or to understand how they can be exploited effectively is still fairly primitive. A large data store today, in practice, is not very far from being a grand, write-only, data tomb. It is my hope that the recent flurry in activity in data mining and KDD will advance us a little towards bringing some life into our data pyramids.
References
- R. Agrawal, H. Mannila, R. Srikant, H. Toivonen, and I.C. Verkamo. Fast discovery of association rules. In Advances in knowledge Discovery and Data Mining, pages 307 – 328. MIT Press, Cambridge, MA, 1996.
- C. M. Bishop. Neural Networks for Pattern Recognition. Oxford University Press, New York, 1995.
- P. Bradley, U. Fayyad, and C. Reina. “Scaling Clustering Algorithms to Large Databases”. Microsoft Research Technical Report, 1998.
- R. Brachman, T. Khabaza, W. Kloesgen, G. Piatetsky-Shapiro, and E. Simoudis. Industrial applications of data mining and knowledge discovery. Communications of ACM, 39(11), 1996.
- S. Chaudhuri, U. Fayyad, J. Bernhardt. “Scalable Classification over SQL Databases”. Microsoft Research Technical Report, 1998.
- E.F. Codd. Providing OLAP (on-line analytical processing) to user-analysts: An IT mandate. Technical report, E.F. Codd and Associates, 1993.
- R.O. Duda and P.E. Hart. Pattern Classification and Scene Analysis. New York: John Wiley, 1973.
- U. Fayyad, G. Piatetsky-Shapiro, P. Smyth, and R. Uthurusamy, editors. Advances in Knowledge Discovery and Data Mining. MIT Press, Cambridge, MA, 1996.
- U. Fayyad, G. Piatetsky-Shapiro, and P. Smyth. From data mining to knowledge discovery: An overview. In Advances in knowledge Discovery and Data Mining, pages 1 – 36. MIT Press, Cambridge, MA, 1996.
- U. Fayyad, D. Haussler, and P. Stolorz. Mining science data. Communications of ACM, 39(11), 1996.
- J. Friedman. On bias, variance, 0/1 – loss, and the curse-of-dimensionality. Data Mining and Knowledge Discovery, 1(1), 1997.
- K. Fukunaga. Statistical Pattern Recognition. Academic Press, NY, 1990.
- C. Glymour, R. Scheines, and P. Spirtes ABD K. Kelly. Discovering Causal Structure. Academic Press, New York, 1987
- D. Heckerman. Bayesian networks for data mining. Data Mining and Knowledge Discovery, 1(1), 1997.
- J. Kettenring and D. Pregibon, editors. Statistics and Massive Data Sets, Report to the Committee on Applied and Theoretical Statistics, Washington, D.C., 1996. National Research Council.
- E.E. Leamer. Specification searches: ad hoc inference with nonexperimental data. Wiley, New York, 1978.
- H. Mannila, H. Toivonen, and A.I. Verkamo. Discovery of frequent episodes in event sequence. Data Mining and Knowledge Discovery, 1(3), 1997.
- M. Mehta, R. Agrawal, and J. Rissanen. Sliq: a fast scalable classifier for data mining. In Proceedings of EDBT 96. Springer Verlag, 1996.
- J. Pearl. Probabilistic Inference in Intelligent Systems. San Mateo, CA: Morgan Kaufmann, 1988.
- G. Piatetsky-Shapiro and W. Frawley, editors. Knowledge Discovery in Databases. MIT Press, Cambridge, MA, 1991.
- J. Rissanen. Modeling by shortest data description. Automatica, pages 465–471, 1978.
- D.W. Scott. Multivariate Density Estimation. New York: Wiley, 1992
- A. Silberschatz and A. Tuzhilin. On subjective measures of interestingness in knowledge discovery. In U. Fayyad and R. Uthurusamy, editors, Proceedings of KDD-95: First International Conference on Knowledge Discovery and Data Mining, pages 275–281, Menlo Park, CA, 1995. AAAI Press.
- C. Silverstein, S. Brin, and R. Motwani. “Beyond Market Baskets: Generalizing Association Rules to Dependence Rules”. Data Mining and Knowledge Discovery, 2(1), 1998.
- J. Tukey. Exploratory Data Analysis. Addison Wesley, 1975.
- V. N. Vapnik. The Nature of Statistical Learning Theory. Springer, New York, 1995.
- C.S. Wallace and J.D. Patrick. Coding decision trees. TR 151, Monash University, Australia, 1991.
- T. Zhang, R. Ramakrishnan, and M. Livny. Birch: A new data clustering algorithm and its applications. Data Mining and Knowledge Discovery, 1(2), 1997.
View Online